Top training tips for using QRISK2 to communicate cardiovascular risk

Having trained over 4,000 individuals to deliver motivational health checks, we thought that we’d use this latest blog post to address some common questions that we receive. In our experience, amongst the most frequently misunderstood aspects of health check delivery relate to the QRISK2 calculator and how best to utilise it to have motivational lifestyle conversations. This post will address five key questions relating to how the QRISK2 tool can be best harnessed to communicate cardiovascular risk and inspire lifestyle change in individuals that undergo a health check.
Common question 1: How big is the impact of age on a QRISK2 result?
Age is a non-modifiable risk factor and it has an extremely significant impact on CVD risk as calculated by the QRISK2 algorithm. The graph below shows the extent of this impact. In it, we see QRISK2 scores changing over time for a male and female (as depicted by the two lines). Importantly, age is the only metric changing for these two hypothetical individuals; all other test results and demographic criteria remain the same over time:
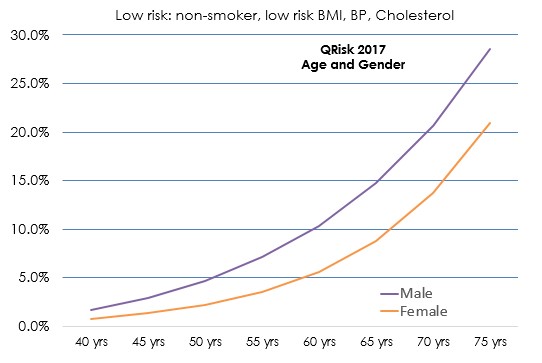
There are very few other CVD risk factors – either modifiable or non-modifiable – that come close to having an impact as large as that which age does when isolated in this way.
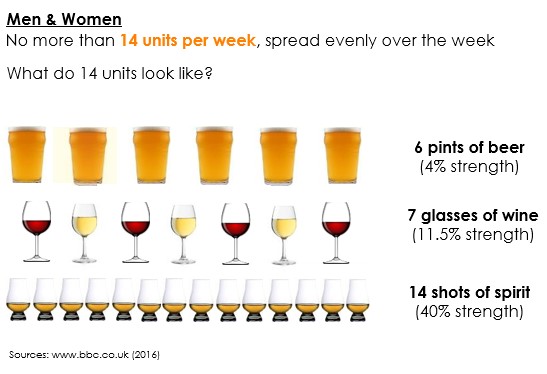
Common question 2: If alcohol is a ‘modifiable’ CVD risk factor, can I use it to modify a QRISK2 result?
No, you can’t. Whilst it may seem counter-intuitive, the way that the QRISK2 algorithm has been created means that if you were to encounter two people with identical results/demographics – with the only difference being that one is a heavy drinker and the other is T-total – their risk scores would be identical.
However, the crucial point to note is that alcohol consumption can often have knock-on effects on a variety of the metrics that do directly impact a QRISK2 result. For instance, BMI, blood pressure and cholesterol, all directly effect a QRISK2 score and all may be affected by an individual’s alcohol intake. If you’re therefore in the position of having a conversation with someone about the impacts of alcohol on cardiovascular risk, it’s vital to address the many indirect effects that alcohol can have.
This question also requires a us to draw a further important distinction; the term ‘modifiable risk factors’ refers to the things about our lives that we have the power to change in order to improve our chances of avoiding a cardiovascular event (such as smoking habits, alcohol consumption or activity levels). However, not all modifiable risk factors will actually ‘modify’ a QRISK2 result. In addition to alcohol, physical activity also doesn’t directly impact a person’s score. However, in many cases, such lifestyle behaviours are key drivers of the measures that do directly influence a QRISK2 result (such as BMI, blood pressure and cholesterol).
Current alcohol guidelines recommend that we don’t exceed the following:
Common question 3: Which measure of cholesterol influences a QRISK2 score and why?
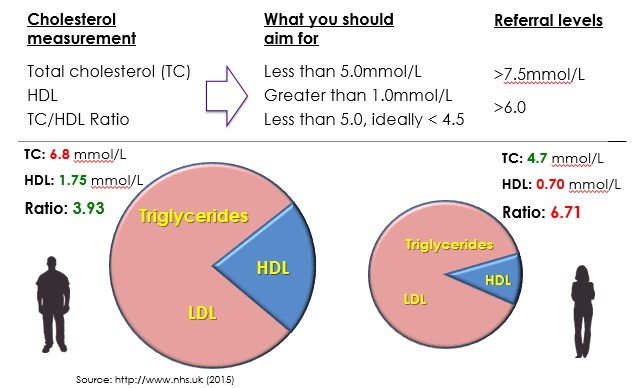
The ratio between the amount of total cholesterol (TC) and high density lipoprotein (HDL) is the key measure insofar as the QRISK2 calculator is concerned. In simple terms, this value represents the amount of ‘good’ cholesterol someone has as a proportion of their total cholesterol (which is also made up of things such as LDL – or ‘bad’ cholesterol – and triglycerides). The greater the proportion of HDL, the more ‘good’ cholesterol there is to keep the ‘bad’ in solution and to prevent it from sticking to artery walls, which can raise the risk of heart attacks and strokes.
The pie charts below demonstrate that just because someone has a larger amount of total cholesterol (as is the case with the male/pie chart on the left), it does not necessarily mean they’re at higher risk of CVD and in greater need of referral. In these examples, the man on the left has a large amount of ‘good’ HDL cholesterol as a proportion of his total cholesterol, and therefore has a relatively low TC/HDL ratio. In contrast, the woman on the right, despite having a smaller total cholesterol value, is actually at greater risk of CVD as calculated by QRISK2 due to her high TC/HDL ratio:
There are various ways that people can decrease their total cholesterol whilst maintaining the HDL levels. According to the British Nutrition Foundation, monounsaturated fats typical of the Mediterranean diet (found in olive oil, rapeseed oil, olives, nuts and avocados) can help maintain levels of good HDL cholesterol and decrease levels of harmful LDL cholesterol
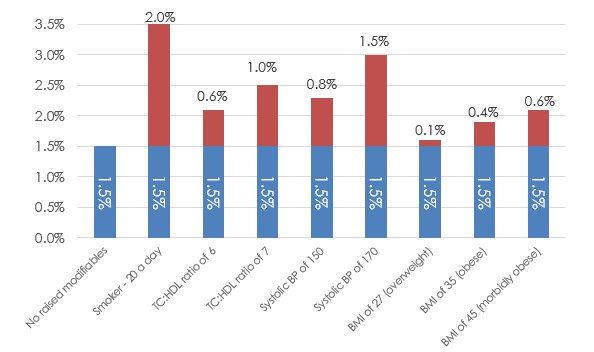
Common question 4: Which modifiable risk factors have the largest effect on the QRISK2 calculation?
Different modifiable risk factors will affect a QRISK2 result to varying degrees. The single biggest risk factor is smoking; being a heavy smoker can have the immediate effect of doubling a QRISK2 score. By contrast, changes in BMI will only have a relatively small effect on a QRISK2 score, even if those changes are quite substantial. However, if someone had lost weight and significantly reduced their BMI, there could well be positive knock-effects on other factors, such as blood pressure and TC/HDL ratio. Therefore, when having motivational lifestyle conversations with individuals, it’s important to remain aware of the potential impacts that changes to one risk factor (e.g. BMI, alcohol or activity) could have on others (e.g. blood pressure or cholesterol).
The bar graph below depicts the relative ‘up-lifts’ to a QRISK2 score that you can expect to see from the presence of different risk factors. The blue bar furthest to the left represents a QRISK2 score of a 40-year old male with no raised modifiable risk factors (1.5% in this example). Each of the subsequent bars to the right demonstrate how various risk factors, when individually added to the equation, could increase that risk score:
Common question 5: How much does social deprivation impact a QRISK2 score?
Deprivation is a significant risk factor for CVD risk. According to Public Health England, premature mortality is as much as twice as high in the most deprived areas compared to the least. This discrepancy between more and less affluent areas is reflected in the QRISK2 calculation.
The charts below depict two sets
of QRISK2/heart age scores. The only difference between the charts is postcode;
the bars on the left include a ‘least deprived’ postcode, whilst those on the
right include a ‘most deprived’ postcode. The other risk factors remain the
same: a 50-year old non-smoking male, with a systolic blood pressure of 119
mm/Hg, a TC/HDL ratio of 4.5 mmol, a BMI of 24.9 kg/m2 and no family history:
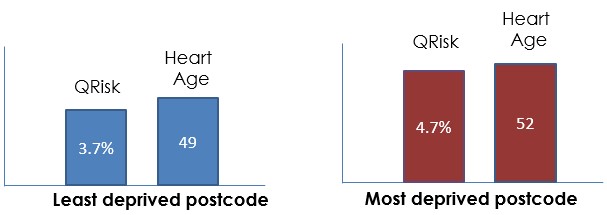
As is clear, this single differentiating factor is enough to separate the heart ages by three whole years. In this example shown, if the person were to live in an area classed as ‘most deprived’, QRISK2 would estimate their heart age to be two years older than their actual age. By comparison, living in a ‘least deprived’ area would result that same individual’s heart age being estimated as younger than their actual age.