![]()
Introduction and link to calculator
For many working on NHS Health Check programmes, point-of-care testing (POCT) is already a significant component of the delivery process. Nonetheless, significant numbers of providers around the country – particularly those based in GP practices – use pathology laboratory testing in favour of POCT. To assist commissioners weighing up the decision of whether or not to introduce POCT, Health Diagnostics have produced a cost-effectiveness calculator that gives clear indications as to the amount local authorities could potentially save over five years by switching to POCT.
Access the POCT cost-effectiveness calculator here.
Non-financial benefits to POCT
In addition to the financial savings that POCT makes possible and which the calculator demostrates, the research on which the tool is based highlights various factors which improve patient experience. Chiefly, this involves the fact that POCT allows for an NHS Health Check to be delivered in a single sitting, thereby minimising the impact on patient/clinician time and reducing the opportunities to incur DNAs. By contrast, the laboratory pathway involves at least two appointments and therefore increases the likelihood of DNAs and incomplete appointments.
The portability of POCT also means that it is conducive to delivering NHS Health Checks in community locations (where path lab testing may not be possible). Research has shown that such community provision facilitates access to potentially vulnerable individuals; according to Woringer et al, “Community-based outreach providers effectively reach under-served groups by delivering preventive CVD services to younger, more deprived populations, and a representative proportion of ethnic minority groups.”
Whilst clinical accuracy is, on occasion, used to justify the continuation of employing traitional path lab testing, increasing evidence to the contrary is available. Various research initiatives (such as that detailed here) have for example concluded that, for many tests, the POCT approach demonstrates “the same or better clinical effectiveness than pathology laboratory testing”.
About this data and instructions for using the calculator
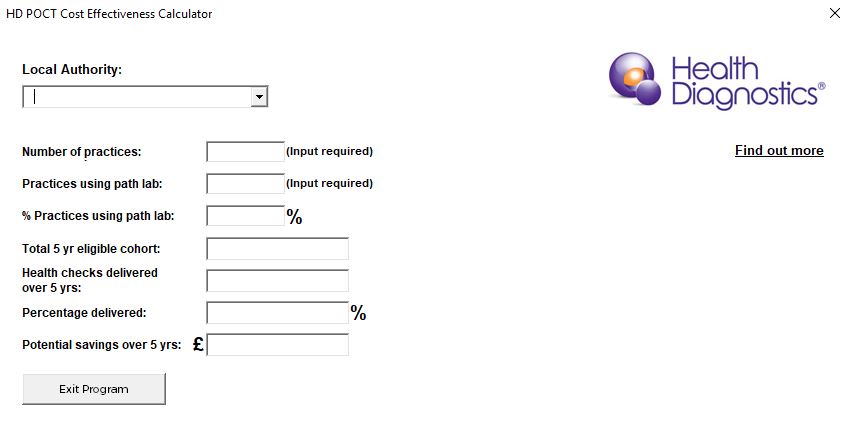
First of all, once you’ve downloaded the Excel document, ensure that the content is accessible by clicking the requisite notifications to enable this. Once enabled, the following window will appear:
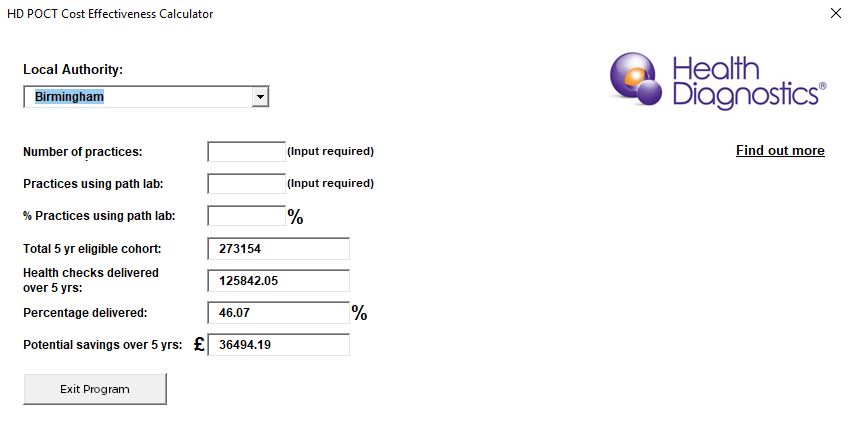
The calculator allows users to select their specific local authority area to ensure that estimations are as granular as possible. This NHS Health Check data is sourced from Public Health England and is up to date as of 22/10/18. If users would like to manually update figures, they are able to; latest data can be sourced here. For example purposes, the image below shows the auto-populated data for Birmingham:
In accordance with the data sampled, the ‘Potential savings over 5 yrs’ value (when auto-populated inputs are used), is in the context of the 5 year eligible cohort and the rate at which local authorities have historically performed. Users can change the ‘Percentage delivered’ value manually if they are wishing to assess alternate performance levels than those auto-populated and the potential savings will change accordingly.
The data driving the cost-effectiveness calculation is sourced from research by Imperial College London that evaluated the question Does use of point-of-care testing improve cost-effectiveness of the NHS Health Check programme in the primary care setting? A cost-minimisation analysis. This study found that the total expected cost of implementing POCT is lower than path lab, “with savings of £29 per 100 invited patients up the point of cardiovascular disease risk score presentation”. It should be noted that participants in this study used the Alere LDX POCT device; different levels of cost savings may be achievable with different devices. Imperial College’s research is accessible here.
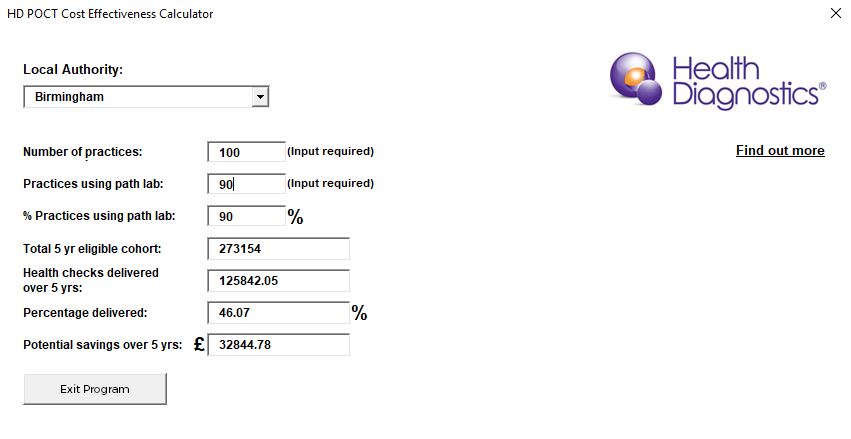
If users do not modify the fields relating to the number of practices in the area and the numbers using path lab, the potential savings displayed will be reflective of 100% of practices moving over to using POCT from path lab. However, users are able to refine the calculation by manually inputting the number of practices in their area, as well as the proportion using path lab. The image of the calculator below (which is purely for example purposes and not necessarily reflective of the reality in Birmingham), assumes 10 practices already use POCT and shows the potential savings over 5 years if the remaining 90 out of 100 local practices were to make the switch:
There are unavoidable limitations to the ‘% Practices using path lab’ approach in that it assumes that all practices have an equally proportionate coverage of the eligible cohort; in reality, this is unlikely to be the case. However, for estimation purposes, such an assumption is required. If users know the proportion of their population that’s catered for by path lab, this can be manually inputted as a percentage instead and the calculation will adjust accordingly.
Next steps for introducing POCT
Once you’ve experimented with the calculator, if you would like to find out more about introducing POCT in your area and/or to recieve a quote for the systems, get in touch with Health Diagnostics.