
Health Diagnostics are delighted to announce that our research poster was selected as the winning entry at Public Health England’s 2018 CVD Prevention Conference. This year’s conference took place at the Kia Oval in London and accommodated over 500 delegates, all of whom are involved in the area of cardiovascular disease prevention. Despite being up against fierce competition, Health Diagnostics’ poster was voted for by these delegates as the leading submission.
Entitled Investigating England’s postcode lottery: An analysis of the relationship between key lifestyle risk factors for cardiovascular disease and socio-economic status, the winning poster is shown below, with it’s contents replicated in text format underneath the image:
Aim
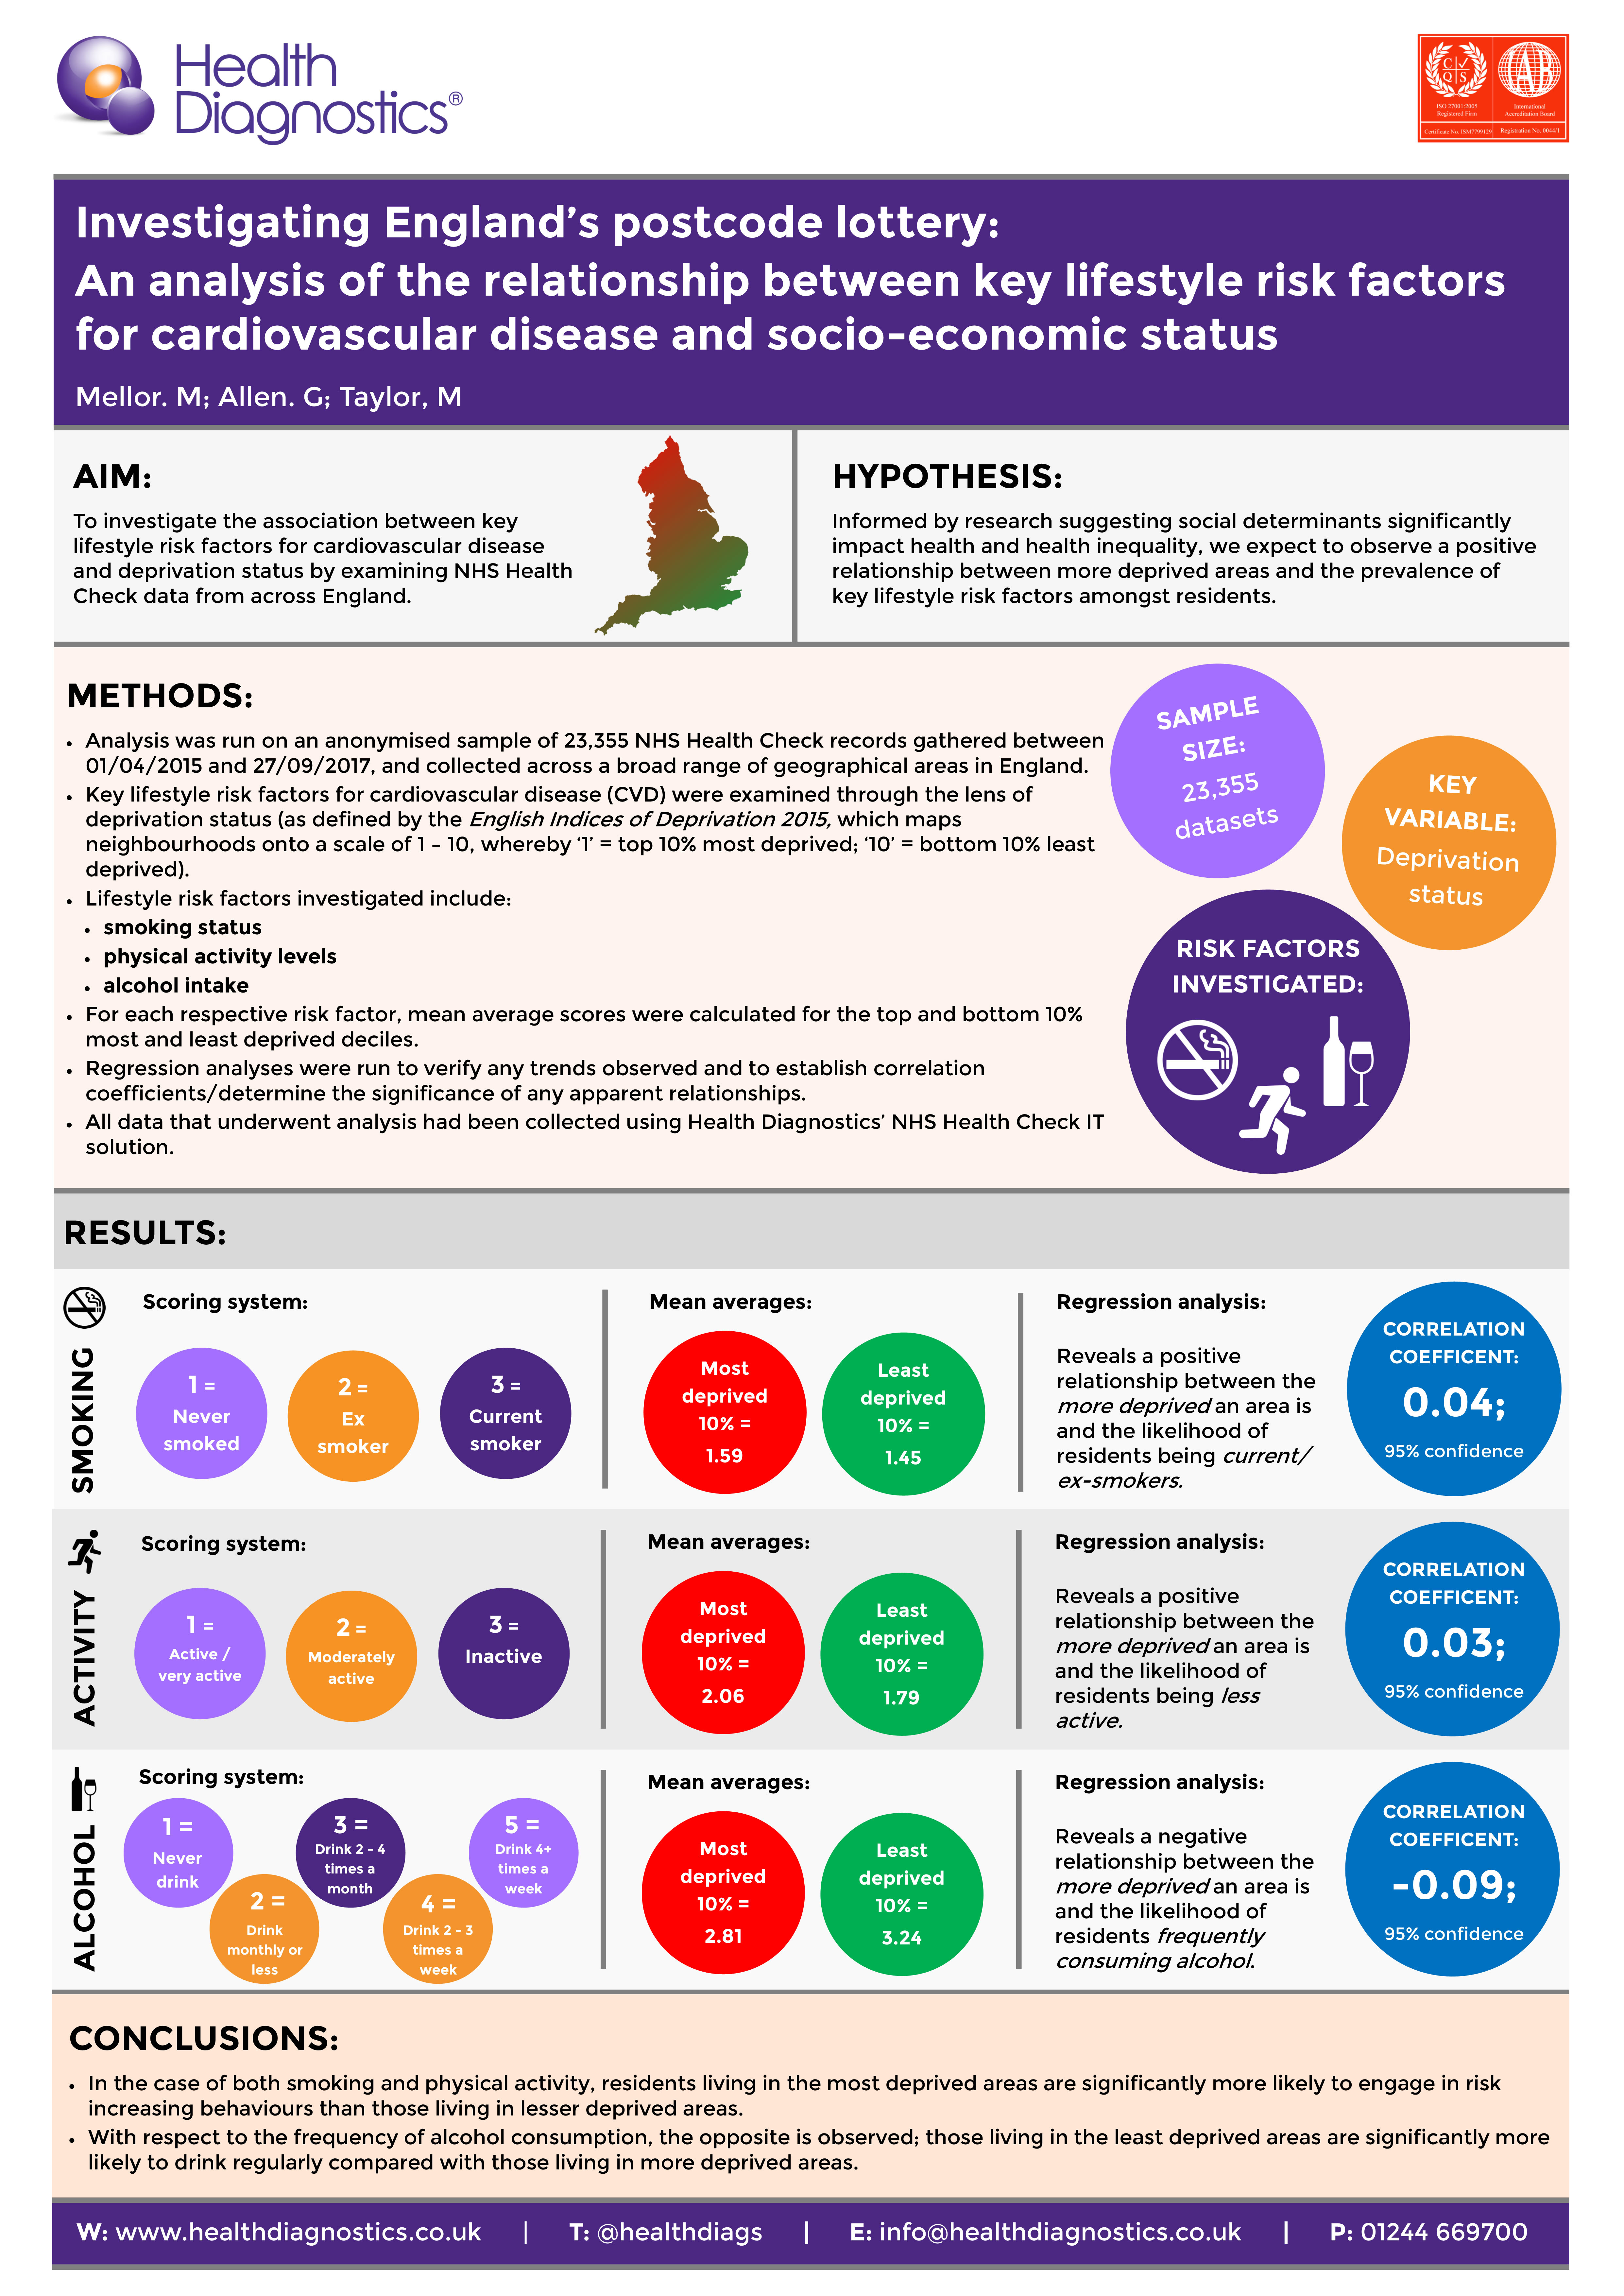
To investigate the association between key lifestyle risk factors for cardiovascular disease and deprivation status by examining NHS Health Check data from across England.
Hypothesis
Informed by research suggesting social determinants significantly impact health and health inequality, we expect to observe a positive relationship between more deprived areas and the prevalence of key lifestyle risk factors amongst residents.
Methods
- Analysis was run on an anonymised sample of 23,355 NHS Health Check records gathered between 01/04/2015 and 27/09/2017, and collected across a broad range of geographical areas in England.
- Key lifestyle risk factors for cardiovascular disease (CVD) were examined through the lens of deprivation status (as defined by the English Indices of Deprivation 2015, which maps neighbourhoods onto a scale of 1 – 10, whereby ‘1’ = top 10% most deprived; ‘10’ = bottom 10% least deprived).
- Lifestyle risk factors investigated include:
- smoking status
- physical activity levels
- alcohol intake
- For each respective risk factor, mean average scores were calculated for the top and bottom 10% most and least deprived deciles.
- Regression analyses were run to verify any trends observed and to establish correlation coefficients/determine the significance of any apparent relationships.
- All data that underwent analysis had been collected using Health Diagnostics’ NHS Health Check IT solution.
Results
Smoking
Scoring system
Never smoked = 1
Ex-smoker = 2
Current smoker = 3
Mean averages
Least deprived 10% = 1.45
Most deprived 10% = 1.59
Regression analysis
Reveals a positive relationship between the more deprived an area is and the likelihood of residents being current/ ex-smokers.
Correlation coefficient = 0.04; 95% confidence
Physical activity
Scoring system
Active/very active = 1
Moderately active = 2
Inactive = 3
Mean averages
Least deprived 10% = 1.79
Most deprived 10% = 2.06
Regression analysis
Reveals a positive relationship between the more deprived an area is and the likelihood of residents being less active.
Correlation coefficient = 0.03; 95% confidence
Alcohol
Scoring system
Never drink = 1
Drink monthly or less = 2
Drink 2 -4 times a month = 3
Drink 2 – 3 times a week = 4
Drink 4+ times a week = 5
Mean averages
Least deprived 10% = 3.24
Most deprived 10% = 2.81
Regression analysis
Reveals a negative relationship between the more deprived an area is and the likelihood of residents frequently consuming alcohol.
Correlation coefficient = -0.09; 95% confidence
Conclusion
- In the case of both smoking and physical activity, residents living in the most deprived areas are significantly more likely to engage in risk increasing behaviours than those living in lesser deprived areas
- With respect to the frequency of alcohol consumption, the opposite is observed; those living in the least deprived areas are significantly more likely to drink regularly compared with those living in more deprived areas.